Just Another Statistics Textbook
  • Report an error
  • Request a clarification
  • Suggest Content

Sum and SumIf

  • Welcome
    • About
    • Installing R(Studio)
  • R Basics
    • Types of Scripts
    • R Fundamentals
    • R Logic
  • Statistics Foundations
    • Statistics Basics
    • Scientific Notation
    • Probability (R)
  • Describing Data
    • Central Tendency (R, Python, Excel, JASP)
    • Dispersion (R,Python, Excel, JASP)
  • Distributions
    • Binomial Distribution (R)
    • Normal Distribution
    • Skewness (R,Python)
    • Transforming Data (R)
  • Correlation
    • Correlations (R,Python)
    • Partial Correlations (R,Python)
  • Regressions
    • Simple regression (R)
    • Multiple Regressions (R)
  • General Linear Models
    • General Linear Models and Sum of Squares (R, Python)
    • T-Tests (R, Python incomplete)
    • One Way ANOVA (incomplete)
    • Repeated Measures ANOVAs
    • Mixed ANOVA (incomplete)
    • ANCOVA (incomplete)
  • Categorical
    • Contingency (R)
  • Item analyses
    • Cronbach’s Alpha (R,Python)
  • Multiple testing
    • Family-Wise Error (R)
    • False Discovery Rate(R)
    • FWER, FDR, Positive and Negative effects(R)
  • Permutations
    • Permutations (R)
    • Permutation vs. t tests (incomplete)
  • Excel tutorial
    • Formulas
    • If function
    • Count and countifs function
    • Sum and SumIf
    • Averageifs
    • Anchoring
  • Test yourself
    • All questions
    • Question Maker

Sum and SumIf

The spreadsheet this worksheet is based on can be downloaded from here. Go to the sum tab at the bottom of excel:

In this example, we would like to calculate the total response times, known as sum. To start with, let’s calculate the SUM for all participants in this spreadsheet:

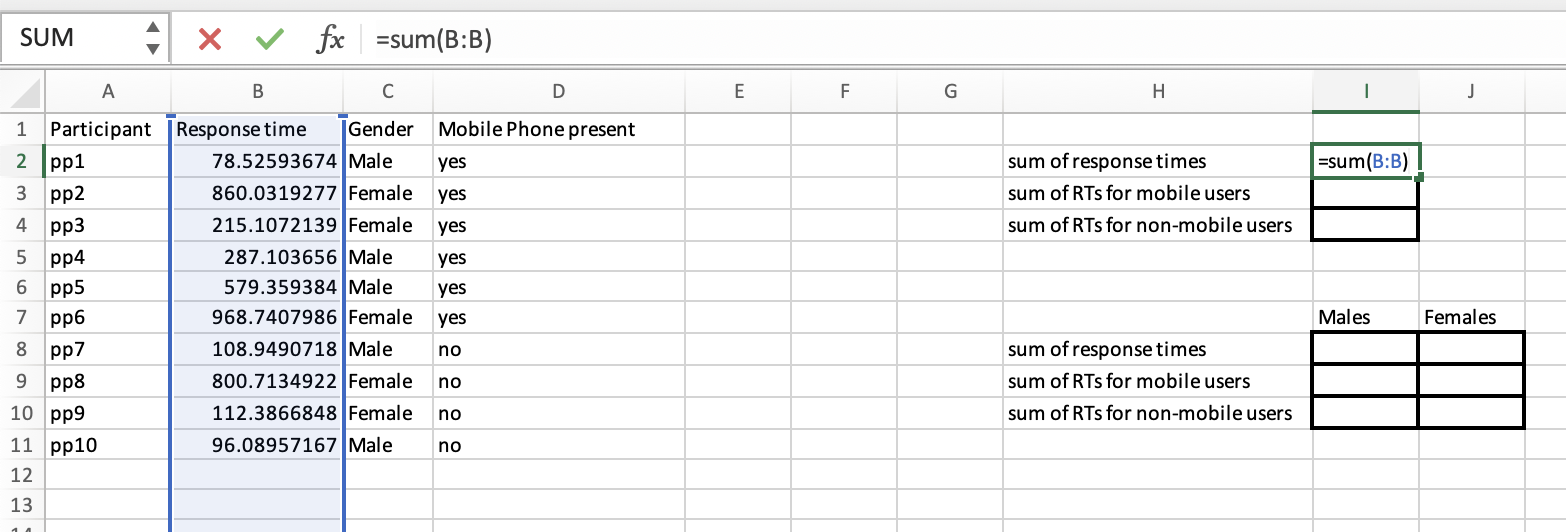
So to calculate the SUM (i.e. total of the selected cells added together), you write a formula as follows:

=sum(START:END)

Now because everything is lined up to have all the mobile users first, and then the non-mobile users, so you can just use the sum function to select the rows where it is “yes” for mobile phone users. It’s not always practical to align your data column by column, so sumifs is a helpful function. Here’s a formula you could run to calculate the sum for females:

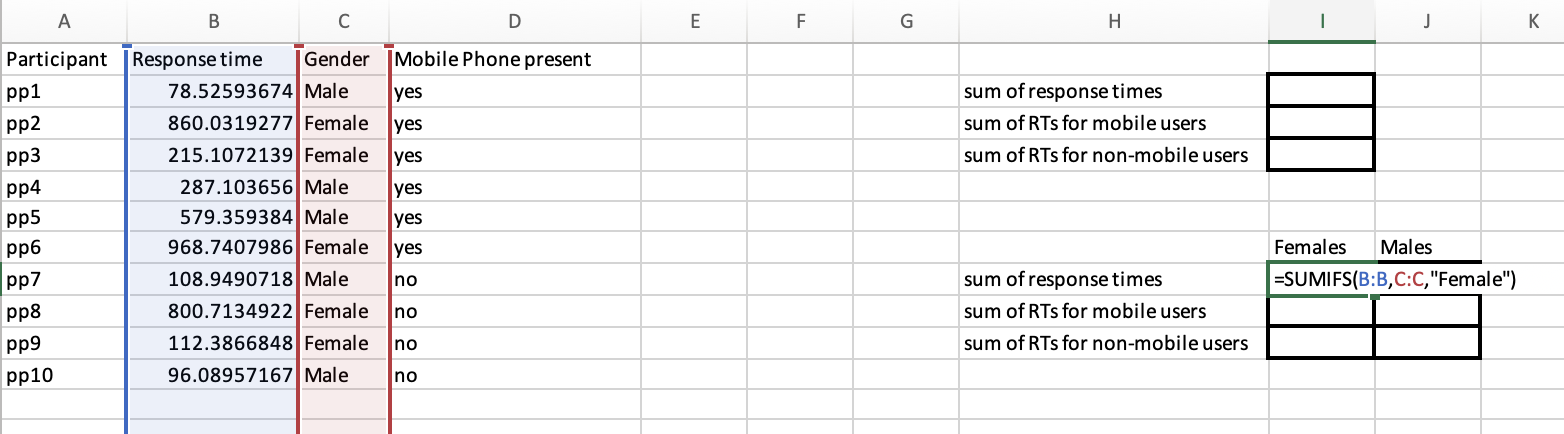
The excel formula’s structure:

=sumifs(cells_you_want_to_sum, selection_crition_cells_1, selction_criterion_1)

You can have as many criterion as you like. Let’s look at females with mobile phones:

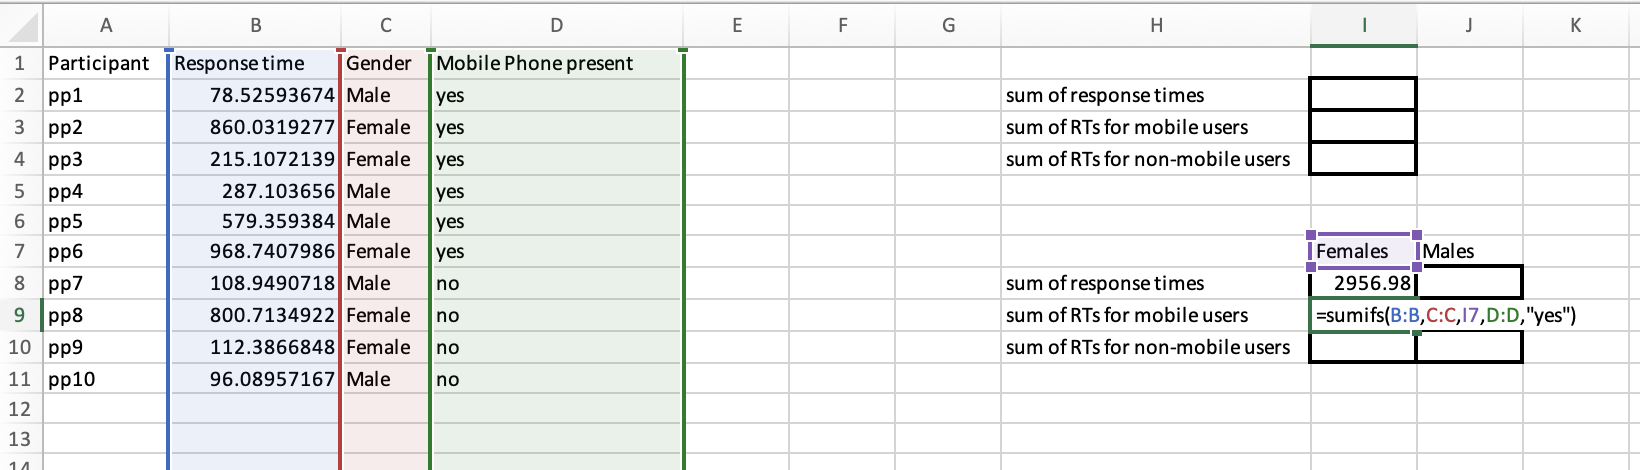
You may have noticed 2 things:

  • You just add an extra criteria column (in this case column D) and a new criteria to compare it to (“yes”) to allow you to have an extra criteria to select your rows on

  • This example compares column C to I7 rather than the word “Females”. Referring to a specific cell can help make your formulas more efficient, as you don’t have to repeatedly type the same word again and again. In fact, arguably it would be better to have anchored I$7 so that you could copy the formula down.